

IO Metrics Visualizer plugin for Unreal Engine
Click to show on FAB
Overview
IO Metrics Visualizer is a lightweight system for visualizing runtime data directly inside your game or tools. It’s built for fast iteration helping you debug, tune, and understand systems without spending time building custom UI.
Core Graph Types
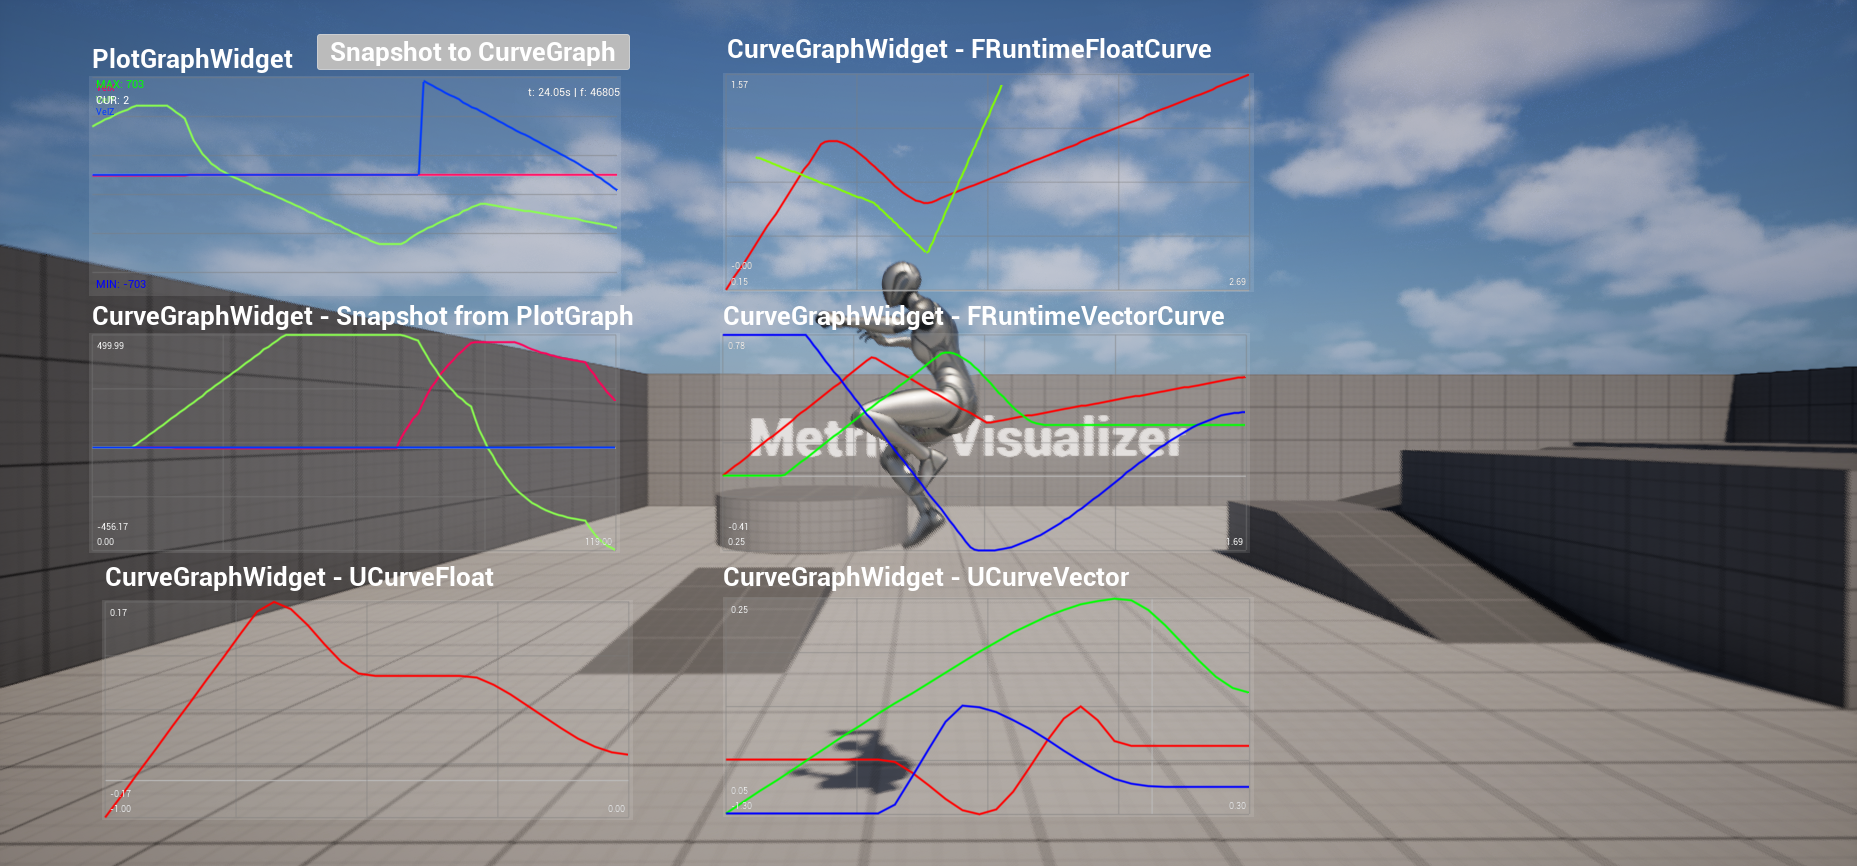
- Plot Graph - real-time, continuously updating values (time-based)
- Curve Graph - static or sampled data (functions, curves, snapshots)
Both support multiple layers, customizable visuals, auto-scaling, and peak holding for clear readability.
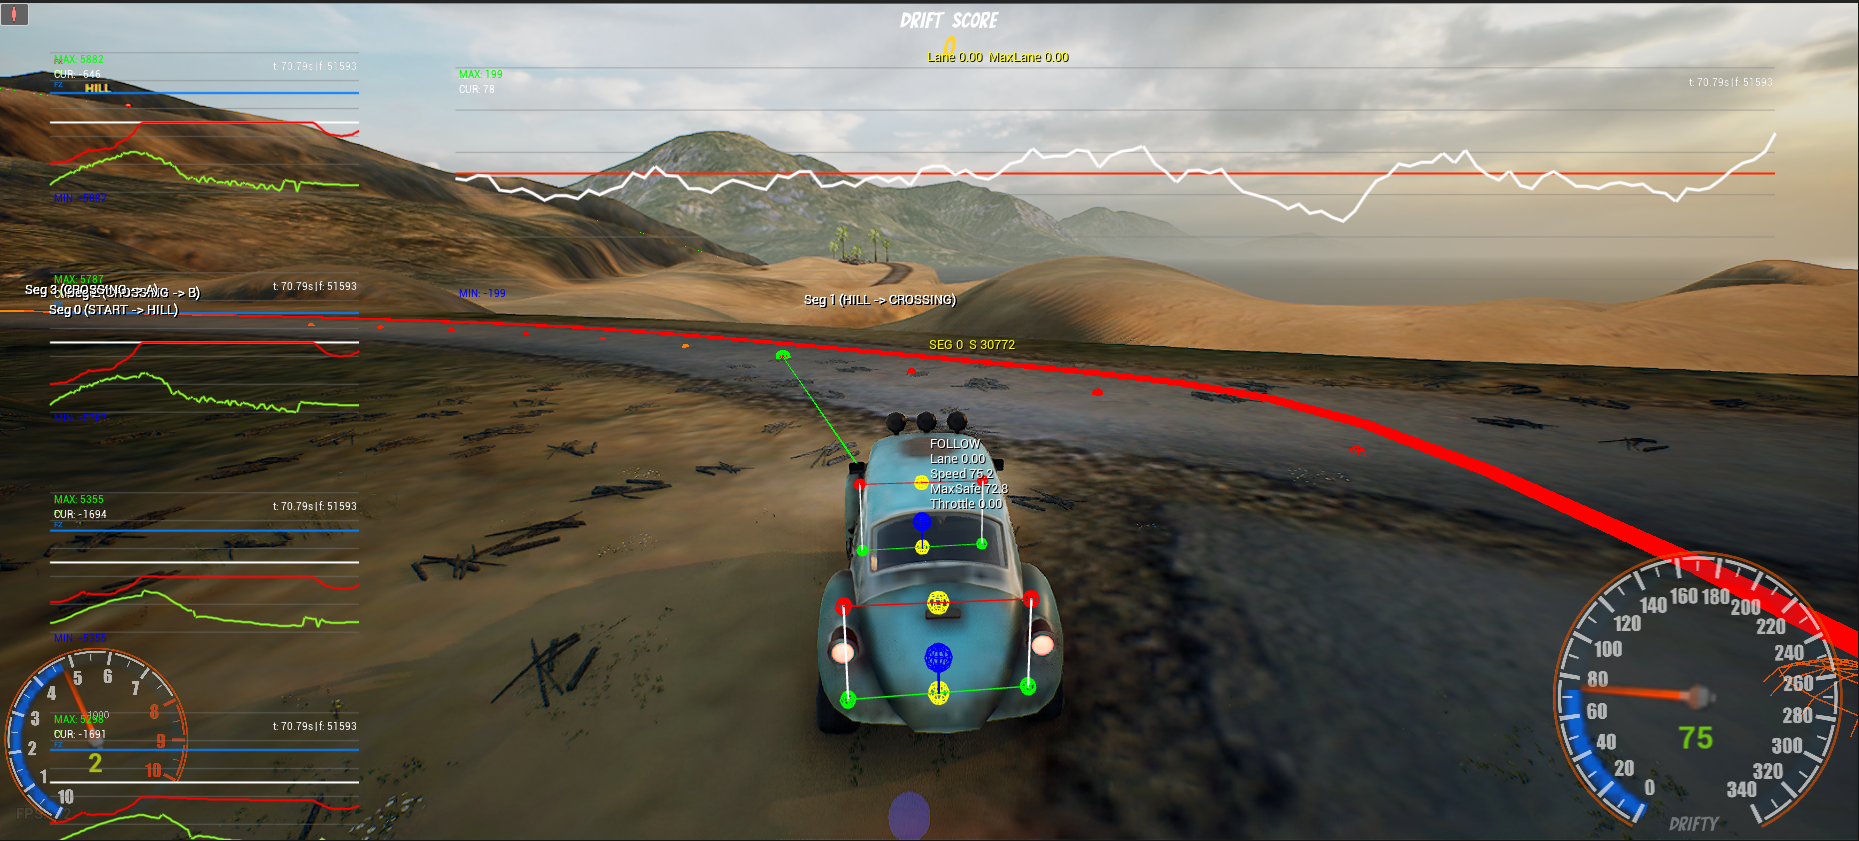
Instant Debug Superpower - AutoPlotGraph
AutoPlotGraph is the fastest way to visualize anything.
You can call it from anywhere (Blueprint or C++) and instantly get a live graph on screen — no setup, no widget creation, no UI work. Just pass a tag and a value, and it appears.
When values stop updating, the graph automatically disappears after a configurable timeout, so your screen stays clean.
This makes it perfect for quick debugging and rapid iteration.
From Runtime to Analysis
You can take live data from a Plot Graph and snapshot it into a Curve Graph.
This lets you freeze behavior and inspect it as a clean curve.
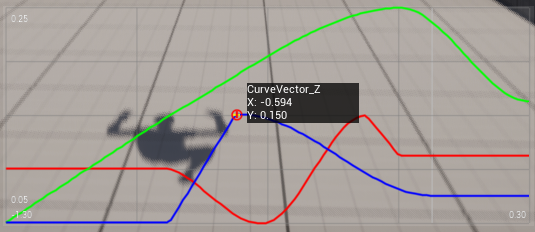
Curve graphs also support mouse hover inspection, so you can read exact values directly from the graph with precision.
Full UI Control
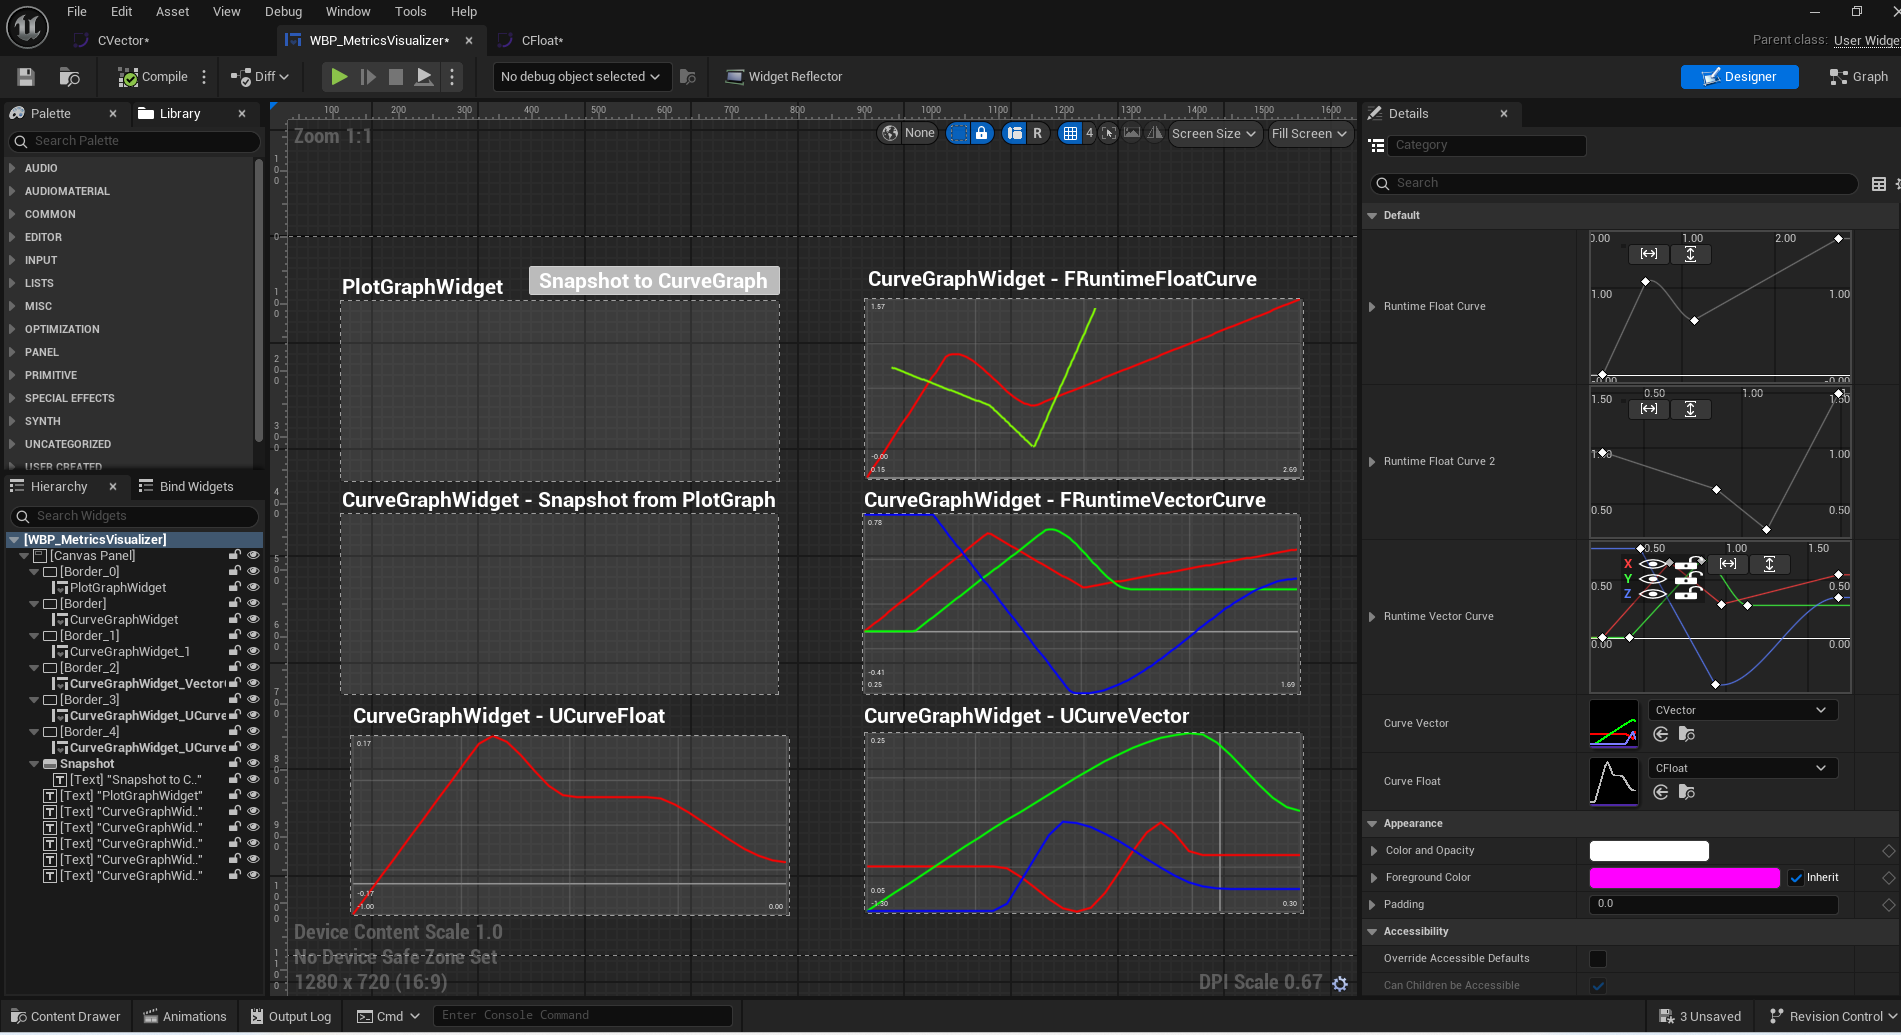
Both UPlotGraphWidget and UCurveGraphWidget are standard UUserWidget-based widgets.
That means you can:
- Place them anywhere in your UI
- Control position, size, and scaling
- Anchor or embed them into existing layouts
You get the best of both worlds — instant graphs when you need speed, and full control when you want a polished UI.
Designed for Workflow
- Fast to use, easy to integrate, and powerful when needed
- IO Metrics Visualizer is built to give you immediate insight into your systems with minimal friction.